For those
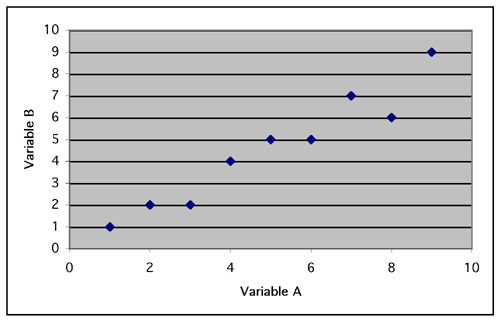
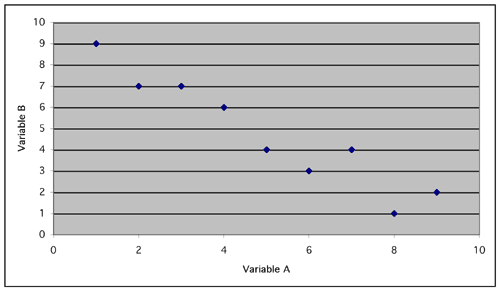
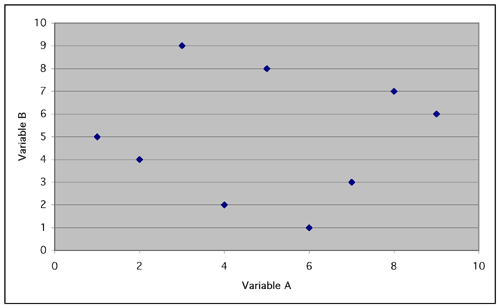
of you who prefer visual thinking, you can "see" different kinds
of correlations in the three scatterplots below. Graph 6 shows
a strong positive correlation between Variable A and Variable B; graph
7 shows a strong negative correlation between Variable A and Variable
B; and graph 8 shows no correlation between the two variables.
Graph 6: Strong positive correlation (r=+.96)

Graph
7: Strong negative correlation (r=-.95)

Graph
8: No correlation (r=.00)
