
talking history | syllabi | students | teachers | puzzle | about us
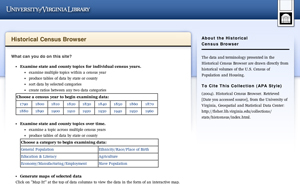
Historical Census Browser
http://mapserver.lib.virginia.edu/
Fisher Library at the University of Virginia, Charlottesville.
Reviewed Aug. 17Aug. 21, 2007.
When I first visited this Web site, I was impressed by the fact that it immediately makes clear exactly what you can, and what you cannot, do. You can examine multiple topics within a census year; produce tables by state or county; sort data by selected categories; and create ratios between any two data categories. You can also examine state, county, and U.S. topics over time and produce tables of data by state or county. Finally, you can generate maps of selected data. Although those possibilities (and their limits) do not become really clear until you start generating tables and accessing data, it was helpful to see this information on the first page.
It was a bit disappointing to learn that you cannot download data, but the site does direct you to the Inter-University Consortium for Political and Social Research (http://www.icpsr.umich.edu/icpsrweb/ICPSR/), where you can download the original data. Also, as with most census data, you cannot find information for areas below the county level.
The data on the site is extensive. It is “drawn directly from historical volumes of the U.S. Census of Population and Housing” and covers the period 17901960, but not more recent periods.
The site is fairly easy to navigate, and I was most impressed with the mapping feature. I have worked with historical census data before, but I think that the structure and design of this site make it fairly accessible to all users. Directions are clear, and in only one or two cases was I momentarily confused about what to do (for example, I wanted to add name labels to my maps, and I had to go to another screen to figure out how to do this).
Mapping columns of data was not only easy to do but also resulted in useful, illuminating, and printable maps. I particularly like that users can map and print the proportionate relationship between two columns. This is a real improvement over the published volumes. You just click on the column that you would like to map and, presto-there is the map. However, the designers could improve the site by adding the ability to produce overlapping maps. For example, I was interested in seeing both the proportion of slaves by state as well as the proportion of foreign-born by state in a given year. I was able to generate two different maps but not one with both sets of information.
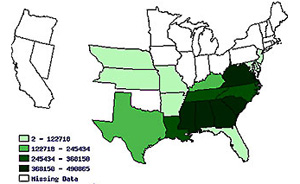
Map illustrating total slave population per state in 1860
Other limitations restrict the calculations the site can perform. While I could get tables that show cross-sectional data over time (for example, the number of slaves in 1790, 1800, etc.), I could not calculate proportionate changes over time. I was also not able to create a map of changes over time. For example, I could not generate a table that showed the percent change in population from 17901840.
In sum, this is not a site for in-depth analysis of data. However, it is a well-done and welcome addition to historical census research. It should be very useful for those who are interested in a quick view of census data at the county, state, or national level.
Clara E. Rodriguez
Fordham University
New York, New York