
talking history | syllabi | students | teachers | puzzle | about us
“Women’s Annual Earnings Are Substantially Lower than Those of Men”: Statistical Studies on Women Workers
During World War II, a number of states passed legislation to combat salary inequities suffered by women workers. Many unions also adopted standards to insure that female employees received the same salaries as males who performed similar jobs. The Equal Pay Act of 1963, the first Federal legislation guaranteeing equal pay for equal work, prohibited firms engaged in interstate commerce from paying workers according to wage rates determined by sex. The following year, Title VII of the landmark Civil Rights Act of 1964 further prevented sex discrimination in employment. Many jobs traditionally identified as women’s work, however, continued to pay lower salaries than those historically classified as jobs for men. The following studies included in testimony to a 1970 Congressional hearing investigating employment discrimination against women presented a statistical snapshot of women workers. The battle for equal pay for work of comparable worth emerged as the “issue of the eighties,” in the words of Eleanor Holmes Norton, chairwoman of the Equal Employment Opportunity Commission (EEOC). By the end of the 1980s, the EEOC had initiated lawsuits against more than 40 states for employment discrimination. More than 1,700 localities passed legislation to address pay inequity.
[U.S. Dept. of Labor, Women’s Bureau, Oct. 1966]
FACT SHEET ON NONWHITE WOMEN WORKERS
Recent social, economic, and political developments have helped to improve the status of nonwhite women workers, but still there are substantial differences in the employment patterns of nonwhite and white women. A higher percentage of nonwhite than white women are in the labor force, are working wives, and are working mothers. In general, nonwhite women have higher unemployment rates, lower income, and less schooling than white women, and more of them are concentrated in low-skilled, low-wage occupations.
There were 3.5 million nonwhite women (about 93 percent of them Negro) in the labor force in 1965. Forty-six percent of all nonwhite women (37 percent of all white women) were workers. Nonwhite women were 13 percent of all women workers and 11 percent of all women in the population.
About 324,000 nonwhite women were seeking work in 1965; their unemployment rate was 9.3 percent (5.0 percent for white women). In 1965 almost every third nonwhite girl (every eighth white girl) 14 to 19 years old was looking for a job.
Nonwhite women were in all major occupational groups in 1965. More nonwhite women (30 percent) were in private-houshold work than in any other single occupation. In contrast, the most popular occupation for white women (34 percent) was clerical work. Another large occupational group for nonwhite women (25 percent) was service work (except private-household). Among white women, approximately the same number were employed in three major occupational groups—professional and technical workers, operatives, and service workers (except private-household). The percent distribution of white and nonwhite women workers in 1965 by major occupational group was as follows:
| Percent distribution of women workers | ||
|
Major occupational group
| White | Nonwhite |
| Total | 100.0 | 100.0 |
| Professional and technical workers | 13.7 | 8 |
| Managers, officials, and proprietors (except farm) | 4.8 | 1.5 |
| Clerical workers | 34.1 | 11.8 |
| Salesworkers | 8.2 | 2.0 |
| Craftsmen and foremen | 1.1 | .7 |
| Operatives | 15.1 | 14.4 |
| Nonfarm laborers | .4 | .7 |
| Private household workers | 5.6 | 30.3 |
| Service workers (except private household) | 14.0 | 24.5 |
| Farmworkers | 2.8 | 5.6 |
About 30 percent of nonwhite women workers (25 percent of white) were on part-time schedules in 1965. More nonwhite than white women reported involuntary part-time work.
Almost 67 percent of nonwhite women (59 percent of white) reported some income in 1964. Their median income was $1,066 ($1,513 for white women). Income of less than $1,000 was reported by almost 48 percent of nonwhite women (39 percent of white). The median wage or salary income of nonwhite full-time year-round women workers ($2,674) in 1964 was 69 percent of that of white women ($3,859). This represented a substantial improvement since 1939, when it was only 38 percent.
Among women with children under 18 years of age, 46 percent of the nonwhite (34 percent of the white) were in the labor force in March 1965. Among women with children 6 to 17 years of age only, 58 percent of the nonwhite (44 percent of the white) were workers. The comparable percentage for nonwhite women with children under 6 years of age was 38 percent (23 percent for white).
The median number of school years completed by nonwhite women workers 18 years of age and over in March 1965 was 11.1 years (12.3 years for white women). Thirty-two percent of nonwhite women workers (17 percent of white) had completed 8 years or less of schooling: 29 percent of nonwhite (44 percent of white) had completed high school (no college); and 8 percent of nonwhite (10 percent of white) had graduated from college.
WOMEN WORKERS TODAY
The 31 million women who are in the labor force today are a cross section of all American women. They are of all ages from 16 to 70 or more and every race and color. They live on farms, in suburbs, and in central cities. They include the married, the single, the widowed, and the divorced or separated.During the last 50 years the ranks of women workers have risen from only 1 out of 5 to almost 2 out of 5 of all American workers:
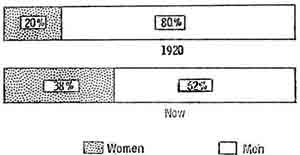
Over this period the profile of the average woman worker has changed greatly—from that of the young (28) single factory worker or clerk of 1920 to that of the older (39) married woman of today who may be found in any of a great many occupations. American women supply many of the workers needed today for growing industries. Their services are equally necessary to the continued smooth functioning of vital health and educational services, factories, stores, and offices. They contribute substantially to the incomes of their families. What kinds of women are they? What jobs do they hold? What are their job patterns? What do they earn? The likelihood that a woman will be a worker varies considerably according to her age, marital and family status, education, race, and, if married, her husband’s income.
Age.—A woman is most likely to be working if she is young and has finished her schooling or if she is mature (35 years and over) and has no young children. She is less apt to work if she is a teenager, is in her childbearing years, or is 65 years of age or over:
|
Percent of labor
|
|
|
Age
|
force in 1969
|
|
16 to 19 years
|
43
|
|
20 to 24 years
|
57
|
|
25 to 34 years
|
44
|
|
35 to 44 years
|
50
|
|
45 to 54 years
|
54
|
|
55 to 64 years
|
43
|
|
65 years and older
|
10
|
|
18 to 64 years
|
49
|
Marital status.—Almost three-fifths of all women workers are married and living with their husbands; more than one-fifth are single; and almost one-fifth are widowed, divorced, or separated from their husbands. Married women are more likely to be workers than are widows (a great many of whom are elderly), but they are less likely to be in the labor force than divorced or separated women or single women:
| Percent in labor | |
|
Marital status
|
force in 1969
|
| Single | 51 |
| Married (husband present) | 40 |
| Divorced or separated | 62 |
| Widowed | 26 |
Children.—About 11.6 million women in the labor force in March 1969 had children under the age of 18 years, but 7.4 million of these working mothers had no children under the age of 6. The presence of young children in the family has a direct effect on the mother’s labor force participation. Among married women living with their husbands, only about 3 out of 10 of those with children under 6 years of age but 5 out of 10 of those with school-age children are workers. Among widows, divorcees, and women separated from their husbands, however, the chances of being in the labor force are about even for those with children under 6 and rise to about 2 out of 3 for those with school-age children only.
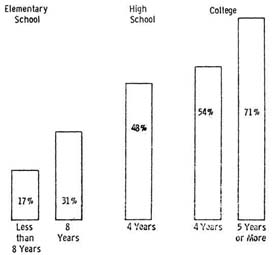
Education.—Two-thirds of all women workers have at least a high school education, and more than 1 out of 10 is a college graduate. Generally the more education a women has, the more likely she is to be in the labor force. In March 1968, labor force participation rates of women ranged from 17 percent for those with less than 5 years of school completed to 71 percent for those with 5 years or more of college:
Race.—About one-eighth of all women workers are Negro.1 The labor force participation rates of Negro women are generally higher than those of white women. Half of all Negro women 16 years of age and over were in the labor force in 1969 (42 percent white), as were 57 percent of Negro women in the usual working ages of 18 to 64 years (49 percent white).
Husband’s income.—A married woman is most apt to be working if her husband’s income is between $5,000 and $6,999 (46 percent) and least apt to be working if her husband’s income is either below $3,000 (35 percent) or $10,000 or over (33 percent).
EMPLOYMENT CHARACTERISTICS OF WOMEN WORKERS
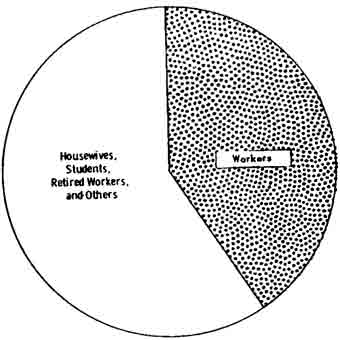
Worklife patterns.—Typically a woman enters the labor force after she has finished her schooling, works for a few years, and leaves the labor force when she marries or has her first child. Then after her children are in school or are grown, she either goes back to paid employment or undertakes some type of community service. The return of mature women to the labor force has been a vital factor in the tremendous increase in the number of women workers in recent years—currently 43 percent of all women 16 years of age and over in the population are workers. Most of the almost 41 million women not in the labor force in 1969 were keeping house:
Full-time and full-year workers.—About 7 out of 10 women workers have full-time jobs at some time during the year, but only about 4 out of 10 work at full-time jobs the year round. Girls 16 to 19 years of age, most of whom are in school, are least likely to be year-round full-time workers (8 percent in 1968), while women 45 to 64 years of age are the most likely to be so employed (54 percent in 1968).
Part-time workers.—Part-time employment frequently is preferred by married women with family responsibilities (especially women with young children), by students, and by women 65 years of age and over. During recent years the shortage of skilled workers in many occupations has provided increasing opportunities for part-time as well as full-time workers. Thus, 11 million women worked at part-time jobs at some time during 1968. Part-time work is most common among farm, private household, and sales workers. But many women also hold part-time jobs as waitresses or cooks; stenographers, typists, or secretaries; teachers; and medical or other health workers.
Occupations.—As shown in the following chart for employed workers in 1969, the occupational distribution of women is very different from that of men:
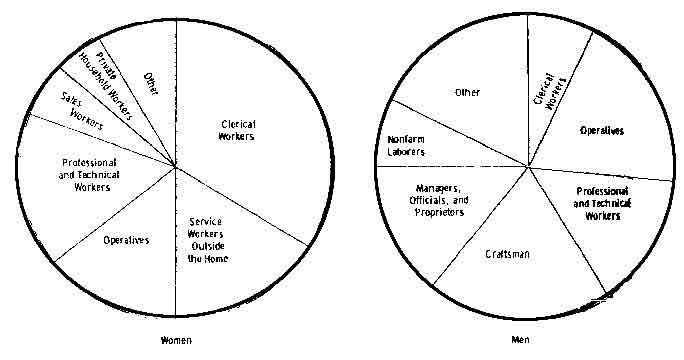
Women are more apt than men to be white-collar workers, but the jobs they hold are usually less skilled and less well paid than those of men. Women professional workers are most apt to be teachers, nurses, and other health workers, while men are most frequently employed in professions other than teaching and health. Women are less likely than men to be managers and officials, and are far more likely to be clerical workers. Only 1 out of 6 women workers is employed in a blue-collar job, but almost half the men are in such jobs. Women are almost as likely as men to be factory workers, but are very seldom employed as skilled craftsmen, the occupation group for 1 out of 5 men workers. More than 1 out of 5 women but only 1 out of 14 men workers is a service worker. Three-fourths of the women and virtually all of the men service workers are employed in occupations other than private household work.
Unemployment.—Unemployment rates are consistently higher for women than for men, for teenagers than for adults, and for Negroes than for whites:
|
Average percent
|
||
|
unemployed in 1969
|
||
|
Race and age
|
Women
|
Men |
| All races |
4.7
|
2.8 |
| 16 to 19 years |
13.3
|
11.4 |
| 20 years and over |
3.7
|
2.1 |
|
Negro and other races (except white) |
7.8
|
5.3 |
| 16 to 19 years |
27.7
|
21.3 |
| 20 years and over |
5.8
|
3.7 |
Earnings.—Women’s annual earnings are substantially lower than those of men. Much of the difference is accounted for by the fact that women are more likely than men to have only part-time and/or part-year jobs. But even among workers fully employed the year round, women’s median earnings are only about three-fifths those of men—$4,457 and $7,664, respectively, in 1968. This gap reflects primarily the differences in the occupational distribution of women and men and in the types and levels of jobs held within each occupation. Median wage or salary incomes of year-round full-time women workers in selected major occupation groups in 1968 were as follows2:
|
Major occupation group
|
Income
|
As percent of men’s income
|
| Professional and technical workers |
$6,691
|
66
|
| Nonfarm managers |
5,635
|
54
|
| Clerical workers |
4,789
|
65
|
| Operatives |
3,991
|
59
|
| Sales workers |
3,461
|
40
|
| Service workers (except private household) |
3,332
|
55
|
Contributions to family income.—The contributions of working wives are of crucial importance where they raise family above the poverty level or from a low to middle range. Only 3 percent of all husband-wife families had incomes below $3,000 in 1968 when the wife was a worker; 10 percent, when she was not. Among all working wives, the median contribution to family income in 1968 was more than one-fourth; among those who worked year round full time, three-eighths.
OUTLOOK FOR WOMEN WORKERS
Shortages of skilled workers in many professional and technical, clerical, and service occupations provide excellent opportunities for qualified women workers. Legislation enacted during the past decade barring discrimination in employment on the basis of sex should open up new opportunities for women to train for and enter more diversified jobs and to advance to jobs of higher skill level. New job opportunities, advances in the educational attainment of women, greater longevity of women, and increased use of household appliances and convenience foods all point to a continuation of the trend towards increased labor force participation of women if the American economy continues its present rate of growth.
[U.S. Dept. of Labor, Women’s Bureau, August 1968]
FACT SHEET ON EDUCATIONAL ATTAINMENT OF NONWHITE WOMEN
Nonwhite women and men have made significant progress in raising their level of educational attainment over the last several decades. The median2 years of school completed by nonwhite women and men 25 years of age and over in March 1967 were 9.8 years and 8.9 years, respectively. The comparable medians in April 1940 were 6.1 years and 5.4 years. The rise in educational attainment has been even more pronounced among nonwhite women and men 25 to 29 years of age. In March 1967 the median years of school completed by nonwhite women in this age group was 12.1 years; by nonwhite men, 12.2 years. In contrast, the median years of school completed by nonwhite women and men 25 to 29 years of age in April 1940 were 7.5 years and 6.5 years, respectively. Another measure of the continuing increase in the level of education achieved by the nonwhite population is the rising proportion of the population 5 to 19 years of age enrolled in school. In 1966, 87 out of 100 nonwhite girls in this age group were enrolled in school. The comparable ratio for nonwhite boys was 90 out of 100. These ratios have increased significantly since the turn of the century.
|
Nonwhite enrollment rates
|
||
|
(per hundred)
|
||
| Year |
Girls
|
Boys
|
| 1960 |
86
|
87
|
| 1950 |
75
|
75
|
| 1940 |
69
|
68
|
| 1900 |
33
|
29
|
A further illustration of the rise in educational attainment of the nonwhite population is a comparison of the proportions who had had completed the various levels of schooling in March 1967 with those in October 1952. About 56 percent of nonwhite women 25 years and over had gone beyond elementary school in March 1967 compared with about 31 percent in October 1952. Among nonwhite men the percentages were 49 and 27. At the upper end of the educational scale, 11 percent of nonwhite women and 10 percent of the men had had some college training in March 1967 than in October 1952. Among women the proportion increased from less than 3 to almost 5 percent. Nonwhite men made even better progress—from 2 to 5 percent. There is a direct relationship between educational attainment and income. The median income in 1966 of nonwhite women and men 25 years of age and over was higher at each level of education attained.
|
Median income in 1966
|
||
|
Nonwhite
|
Nonwhite
|
|
| Years of school completed |
women
|
men
|
| Less than 8 years |
$932
|
$2,376
|
| 8 years |
1,303
|
3,681
|
| 1 to 3 years of high school |
1,698
|
4,278
|
| 4 years of high school |
2,475
|
5,188
|
| Some college |
2,964
|
5,928
|
The median income of nonwhite women was lower than that of nonwhite men at every level of educational attainment. The gap was narrower between those with some college, but even at this educational level the median income of the women was only 67 percent of that of the men. Among year-round full-time workers, the 1966 median wage or salary income of nonwhite women was only 65 percent of that of nonwhite men.
NOTE.—The figures in this fact sheet are from the U.S. Department of Commerce, Bureau of the Census.
[U.S. Dept. of Labor, Women’s Bureau, May 1970]
WOMEN PRIVATE HOUSEHOLD WORKERS FACT SHEET3
In 1969 about 1.6 million women were employed as private household workers—including
babysitters. Women constituted 98 percent of all workers in private household
employment. Annual wages in this occupation are very low: In 1968
the median wage of even those women 14 years of age and over who were
year-round full-time private household workers, including baby- sitters,
was $1,523.4 The
total cash income—which included wage and self-employment income as
well as all forms of social insurance and public assistance payments— as
well as all forms of social insurance and public assistance payments—of
almost all women in this field of employment in 1968 was still very low: 82
percent had total cash incomes under $2,000, and 57 percent, under $1,000. Median
total cash income of the women who were year-round full-time workers—about
one-fifth the total—was &#was $1,701. Almost three-fifths of the women
heads of families who reported private household work as the job held longest
during 1968 had incomes below the poverty level.5
The low annual wages of almost all women private household workers reflect
the intermittent character of their employment as well as their low rates of
pay when employed: Part time/full time: In 1969,
64 percent of the women private household workers worked part time (less than
35 hours a week). Of the full-time workers, 64 percent worked
between 35 and 40 hours a week. The remaining 36 percent worked longer hours.
Part year/full year: Of women private household
workers in 1968: 4 out of 10 worked 26 weeks or less;
2 out of 10 worked between 27 and 49 weeks; and About
4 out of 10 worked 50 to 52 weeks. Many women private household workers
are heads of families: Nearly 200,000 women in this occupation
were heads of families in March 1969. In 1960,
two-thirds of the faimilies headed by either men or women private household
workers included children under 18 years of age. About one- fourth
of the families with children under 18 had at least four children in the family.
Of the 1.4 million women 14 years of age and over who reported their occupations
as dayworkers, housekeepers, maids, and laundresses, but excluding babysitters,
in 1960: More lived in the South than elsewhere: About
54 percent were in the South; Over 19 percent were in the
Northeastern States; About 18 percent were in the North Central
States; and More than 9 percent were in the West. Negroes
predominated: Some 64 percent were Negro; About
35 percent were white; and Almost 1 percent were other nonwhites.
Relatively few were “live-in” workers: About
11 percent “lived in.” This was an urban occupation: About
74 percent were in urban areas; Some 21 percent were in rural
nonfarm areas; and About 5 percent were in rural farm areas.
The average private household worker was about 6 years older than
the typical woman in the labor force: The median age of all
employed household workers was 46 years. 53 percent were 45 years and over;
29 percent were over 55; and 10 percent were 65 and over. The
median age for white employed private household workers was 53 years, compared
with 43 years for nonwhites. In March 1949 less than 3 out of 10 private
household workers were single: 27 percent were single;
37 percent were married and living with their husbands;
and
36 percent were either widowed, divorced, or separated.
Educationally, the private household worker is disadvantaged:
|
Women private household workers6 |
|||
| Educational Attainment March 1968 |
Total
|
White
|
Nonwhite
|
| Years: Median years of school completed |
8.8
|
9.5
|
8.4
|
| Percent: | |||
| Less than 8 years7 |
32.3
|
22.4
|
42.0
|
|
High School completed |
19.3
|
25.3
|
13.5
|
|
Some college (1 to 4 years or more) |
4.2 | 7.0 | 1.3 |
Legislatively, the private household worker is disadvantaged: Workers in this occupation receive credits toward an old-age, survivors, or disability pension only if they earn a maximum of $50 from any one employer in a calendar quarter. While private household workers are eligible for coverage under the Social Security Act, they are not covered by the Federal minimum wage and hour law. By and large, they are not afforded the protection of the major forms of labor legislation and social insurance from which most other workers benefit:
Wages.—Wisconsin is the only State with a minimum wage order which, effective July 1, 1970, covers domestic service workers (women and minors) without numerical or hourly exclusions. Private househo
Source: Congress, House, Committee on Education and Labor, Discrimination Against Women,, 91st Congress, 2d Session (Washington, DC: U.S. Government Printing Office, 1970).